KGGSEE: A biological Knowledge-based mining platform for Genomic and Genetic association Summary statistics using gEne Expression
User manual 1.0
Miaoxin Li, Lin Jiang, Xiangyi Li
1 Introduction
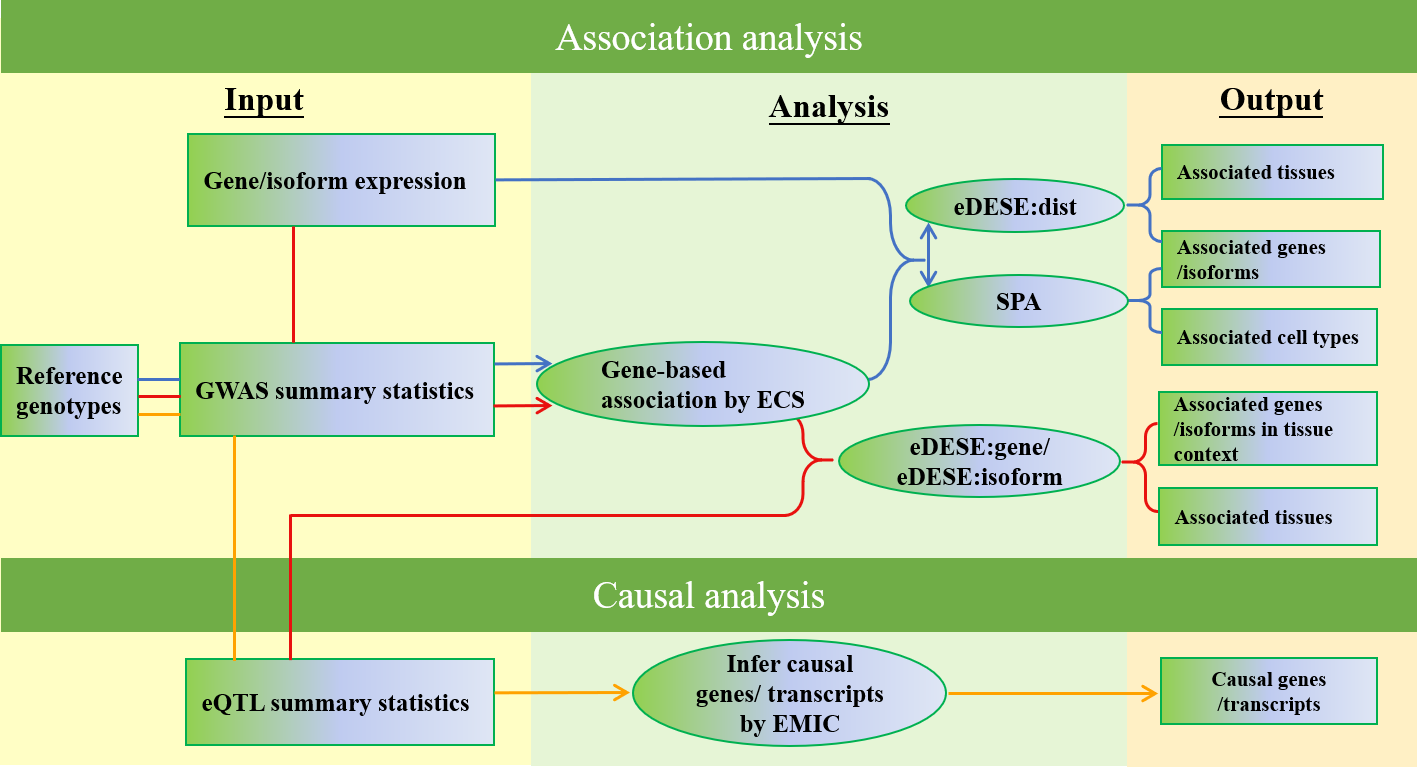
KGGSEE is a standalone Java tool for knowledge-based analyses and can perform association analysis and causative inference analysis based on the genomic and genetic association summary statistics of complex phenotypes, gene expression profiles and related data. It can perform four major integrative analyses:
Gene-based association analysis;
Estimate phenotype-associated tissues or cell-type based on gene expression of single-cell or bulk cells in different tissues;
Conditional gene-based association analysis based on an improved effective chi-squared statistic (ECS) and multiple variant-gene mapping strategies;
Causal gene inference for complex diseases and traits based on multiple eQTLs.
More integrative analysis functions will be added to KGGSEE in the future.
2 Installation
2.1 kggsee.jar
The main library of KGGSEE, kggsee.jar, does not need an installation procedure as long as its Java Runtime Environment(JRE) v1.8 (or up) is pre-installed in your machine. The kggsee.jar can be directly executed given a file path.
2.2 Resource data
In the KGGSEE working folder, a folder named resources contains the running resource data, e.g., gene boundary and gene expression. KGGSEE will automatically download the required resource files to this folder. Users can also manually download all the files and put them into the corresponding folders.
3 Tutorials
3.1 Gene-based association analysis
- Purpose: Detect the phenotype-associated genes of a phenotype using the GWAS summary statistics.
Input data:
GWAS summary statistics compressed in a text file (a fabled data set for education purposes): examples/gwas.sum.stat.gz
Genotypes in VCF format to approximate the correction between summary statistics: resources/hg19/gty/1kg.phase3.v5.shapeit2.eur.hg19.chr1.vcf.gz
java -Xmx10g -jar kggsee.jar \
--nt 10 \
--gene-assoc \
--sum-file examples/gwas.sum.stat.gz \
--vcf-ref resources/hg19/gty/1kg.phase3.v5.shapeit2.eur.hg19.chr*.vcf.gz \
--keep-ref \
--out examples/out/geneAssoc
Important Note: The parameter of "--vcf-ref" is the genotypes in VCF format and can be downloaded from https://pmglab.top/genotypes/#/. The users should download the proper vcf files according to their research subjects' ancestry. The combination of "--vcf-ref" and "--keep-ref" can keep the parsed vcf data (KGGSEE object format) in a local folder named like "VCFRefhg19" under the output folder (here is the "examples/out/geneAssoc"). When the users want to run another analysis, the users can use the option "--saved-ref" instead of the "--vcf-ref" and "keep-ref" to save time. The parameter of "--saved-ref" is the full path of folder "VCFRefhg19" (see example in the following part).
3.2 Estimate the phenotype-associated cell-types of a phenotype (DESE)
- Purpose: Estimate the relevant cell-types of a phenotype and finely map associated genes according to selective expression.
Input data:
GWAS summary statistics compressed in a text file(a fabled data set for education purposes): examples/gwas.sum.stat.gz
Genotypes in KGGSEE objects(generated in Gene-based association analysis) to approximate the correction between summary statistics: examples/out/geneAssoc
Gene expression data compressed in a text file: resources/hs_scRNA_cluster_mean.tsv.gz
java -Xmx10g -jar kggsee.jar \
--nt 10 \
--gene-finemapping \
--expression-file resources/hs_scRNA_cluster_mean.tsv.gz \
--only-hgnc-gene \
--sum-file examples/gwas.sum.stat.gz \
--saved-ref  examples/out/geneAssoc \
--out examples/out/spa \
--excel
3.3 Conditional gene-based association analysis with eDESE
Purpose: Perform conditional gene-based association analysis using different strategies to map variants to genes, i.e., physically nearby variants, gene-level and isoform-level eQTLs (also are variants). Three strategies correspond to three models, i.e., eDESE:dist, eDESE:gene and eDESE:isoform, respectively.
eDESE:dist
Input data:
GWAS summary statistics compressed in a text file (a fabled data set for education purposes): examples/gwas.sum.stat.gz;
Genotypes in KGGSEE objects (generated in Gene-based association analysis) to approximate the correction between summary statistics: examples/out/geneAssoc;
Gene expression data compressed in a text file: resources/gtex.v8.gene.mean.tsv.gz. We have provided the dataset based on the gene-expression profiles of ~50 tissues in GTEX(v8) and has been packaged this file in the download of "KGGSEE+Resources" at http://pmglab.top/kggsee/#/download. Users can also use their own gene expression profiles. The row index is gene name, and the column name is tissue name and tissue name +".SE". Each tissue has two columns, one representing the average expression value of all samples of the tissue and the other representing the standard error of the mean (SE).
java -Xmx20g \
-jar kggsee.jar \
--nt 10 \
--sum-file examples/gwas.sum.stat.gz \
--chrom-col CHR \
--pos-col BP \
--p-col P \
--gene-finemapping \
--saved-ref  examples/out/geneAssoc \
--expression-file resources/gtex.v8.gene.mean.tsv.gz \
--only-hgnc-gene \
--p-value-cutoff 0.05 \
--multiple-testing bonf \
--regions-out chr6:27477797-34448354 \
--out examples/out/geneAssoceQTL
eDESE:gene
Input data:
The GWAS summary statistics compressed in a text file(a fabled data set for education purposes): examples/gwas.sum.stat.gz;
Genotypes in KGGSEE objects to approximate the correction between summary statistics (generated in Gene-based association analysis): examples/out/geneAssoc;
Gene-level expression data compressed in a .gz or text file: resources/gtex.v8.gene.mean.tsv.gz. We have provided the dataset based on the gene-expression profiles of ~50 tissues in GTEX(v8) and has been packaged this file in the download of "KGGSEE+Resources" at http://pmglab.top/kggsee/#/download. Users can also use their own gene expression profiles.
eQTLs data compressed in a gz or text file: resources/hg19/eqtl/Brain-FrontalCortex_BA9_.gene.maf05.p01.gz.eqtl.txt.gz. Our pre-calculated gene-level eQTLs based on GTEx(v8) can be downloaded from here.
java -Xmx20g \
-jar kggsee.jar \
--nt 10 \
--chrom-col CHR \
--pos-col BP \
--p-col P \
--gene-finemapping \
--sum-file examples/gwas.sum.stat.gz \
--saved-ref  examples/out/geneAssoc \
--expression-file resources/gtex.v8.gene.mean.tsv.gz \
--eqtl-file resources/hg19/eqtl/Brain-FrontalCortex_BA9.gene.maf05.p01.gz.eqtl.txt.gz \
--filter-eqtl-p 0.01 \
--only-hgnc-gene \
--p-value-cutoff 0.05 \
--multiple-testing bonf \
--regions-out chr6:27477797-34448354 \
--out examples/out/geneAssoceQTL
eDESE:isoform
Input data:
The GWAS summary statistics compressed in a text file(a fabled data set for education purposes): examples/gwas.sum.stat.gz;
Genotypes in KGGSEE objects to approximate the correction between summary statistics(generated in Gene-based association analysis): examples/out/geneAssoc;
Isoform-level expression data compressed in a .gz or text file: resources/gtex.v8.transcript.mean.tsv.gz. We have provided the dataset based on the isoform/transcript-expression profiles of ~ 50 tissues in GTEX(v8) and has been packaged this file in the download of "KGGSEE+Resources" at http://pmglab.top/kggsee/#/download. Users can also use their own isoform-level expression profiles.
IsoQTL data compressed in a gz or text file: resources/hg19/eqtl/Brain-FrontalCortex_BA9_.transcript.maf05.p01.gz.eqtl.txt.gz.Our pre-calculated isoform-level eQTLs based on GTEx(v8) can be downloaded from here.
java -Xmx20g \
-jar kggsee.jar \
--nt 10 \
--sum-file examples/gwas.sum.stat.gz \
--chrom-col CHR \
--pos-col BP \
--p-col P \
--gene-finemapping \
--saved-ref  examples/out/geneAssoc \
--expression-file resources/gtex.v8.transcript.mean.tsv.gz \
--eqtl-file resources/hg19/eqtl/Brain-FrontalCortex_BA9_.transcript.maf05.p01.gz.eqtl.txt.gz \
--filter-eqtl-p 0.01 \
--only-hgnc-gene \
--p-value-cutoff 0.05 \
--multiple-testing bonf \
--regions-out chr6:27477797-34448354 \
--out examples/out/geneAssoceQTL
3.4 Gene-based causality analysis
- Purpose: Detect the causal genes of a phenotype using the GWAS summary statistics and eQTL.
Input data:
GWAS summary statistics compressed in a text file(a fabled data set for education purpose): examples/gwas.sum.stat.gz
Genotypes in KGGSEE objects(generated in Gene-based association analysis) to approximate the correction between summary statistics: examples/out/geneAssoc
eQTL summary statistics compressed in a text file: resources/hg19/eqtl/Brain-FrontalCortex_BA9_.transcript.maf05.p05.gz.eqtl.txt.gz
java -Xmx10g  -jar kggsee.jar \
--nt 10 \
--emic \
--eqtl-file resources/hg19/eqtl/Brain-FrontalCortex_BA9_.transcript.maf05.p05.gz.eqtl.txt.gz \
--sum-file examples/gwas.sum.stat.gz \
--beta-type 2 \
--saved-ref  examples/out/geneAssoc \
--out examples/out/emic \
--excel
3.5 Drug repositioning based on the drug selective perturbation analysis(SelDP)
Purpose: Estimate the drug selective perturbation effect on the phenotype-associated genes' expression to aid the drug repositioning for complex diseases.
Input data:
GWAS summary statistics compressed in a text file (a fabled data set for education purpose): examples/gwas.sum.stat.gz;
Genotypes in KGGSEE objects (generated in Gene-based association analysis) to approximate the correction between summary statistics: examples/out/geneAssoc;
Drug/compound-induced gene expression fold changes (log2(Treated/Control)) profiles. We provided an example of drug-induced fold changes based on the Level 3 data of LINCS (2017 release) at raw perturbation profile or reverse perturbation profile;
eQTL data of phenotype-associated tissues. The eQTL-guided SelDP needs the eQTL data as one of the input datasets. We have procalculated ~50 tissues' gene-level and transcript-level eQTL data based on the GTEx (v8), and the eQTL data can be accessed at gene-level eQTLs and transcript-level eQTLs.
The command for original SelDP:
java -Xmx20g \
-jar kggsee.jar \
--nt 10 \
--sum-file examples/gwas.sum.stat.gz \
--chrom-col CHR \
--pos-col BP \
--p-col P \
--gene-finemapping \
--saved-ref  examples/out/geneAssoc \
--expression-file drug-induced.gene.expression.fold.change.profile \
--only-hgnc-gene \
--p-value-cutoff 0.05 \
--multiple-testing bonf \
--regions-out chr6:27477797-34448354 \
--out examples/out/Selective_Perturbed_Drugs
The command for eQTL-guided SelDP:
java -Xmx20g \
-jar kggsee.jar \
--nt 10 \
--chrom-col CHR \
--pos-col BP \
--p-col P \
--gene-finemapping \
--sum-file examples/gwas.sum.stat.gz \
--saved-ref  examples/out/geneAssoc \
--expression-file drug-induced.gene.expression.fold.change.profile \
--eqtl-file resources/hg19/eqtl/Brain-FrontalCortex_BA9_.gene.maf05.p01.gz.eqtl.txt.gz \
--filter-eqtl-p 0.01 \
--only-hgnc-gene \
--p-value-cutoff 0.05 \
--multiple-testing bonf \
--regions-out chr6:27477797-34448354 \
--out examples/out/Selective_Perturbed_Drugs
4 Functions
4.1 Gene-based association analysis by an effective chi-square statistics(ECS)
One can perform the gene-based association analysis by an effective chi-square statistics (ECS) with the GWAS p-values of variants. The p-values are converted to chi-square statistics(degree of freedom = 1). The ECS merges all chi-square statistics of a gene after correcting the redundancy of the statistics due to LD. The LD is calculated from genotypes of an ancestrally matched sample in VCF format, e.g., a panel of 1000 Genomes Project. The method of ECS is described in our paper(Paper Link).
Required options
--gene-assoc--sum-file [/path/to/summary/file]--vcf-ref [/path/to/vcf/file]--keep-ref[--saved-ref "previous/output/path/prefix"]--out [output/path/prefix]
See an analysis example at: Gene-based association analysis
Explanations and Optional options
--gene-assoc: The main function option.--sum-file: The file containing GWAS summary statistics.Three columns of the GWAS summary statistic file, i.e., chromosome, physical position and p-value are a minimal requirement. The default column names are CHR, BP and P, respectively. Otherwise, users should specify the name by using
--chrom-col,--pos-coland--p-col, respectively.CHR
BP
P
1
751756
0.979957
1
752566
0.863844
1
752894
0.55814
1
753405
0.968401
1
755890
0.918246
--vcf-ref: The file containing the genotypes to calculate the genotypic correlations. For the data separated in multiple files by chromosomes, one can use the asterisk wildcard (e.g., hg19.chr*.vcf.gz) to denote the chromosome names.--keep-ref: If used, the option will enable to save the encoded genotypes in VCF for future usage, which will speed up the next analysis.--saved-ref: Instead of using--vcf-ref, one can directly specify the path of the encoded genotypes generated last time by specifying the last output path.--filter-maf-le: Filter out the variants with minor allele frequency less or equal than the specified value.--out: Specify the path and prefix name of the output files. The main output file of the gene-based analysis is *.gene.pvalue.txt or *.gene.pvalue.xls. The following is an example:Gene
#Var
ECSP
Chrom
Pos
VarP
Ingored
RefGene
GENCODE
RERE-AS1
21
7.83E-10
1
8490320
1.17E-10
0
…
…
RNU6-2
11
0.442684
1
10355834
0.146355
0
…
…
PTPRF
188
4.59E-11
1
44083015
4.09E-11
0
…
…
Columns in the output file are gene symbol, the number of variants in the gene, p-values of gene-based association test, and the detailed information of the top variant within the gene(i.e., the variant with the smallest p-value). These columns include chromosome, physical position, p-value, whether the top variant was ignored in the gene-based association analysis, and gene feature annotations according to RefGene and GENCODE.
4.2 Finely map genes and estimate relevant cell types of a phenotype by the single-cell (or bulk-cell) type and phenotype cross annotation framework(DESE)
One can simultaneously prioritize phenotype-associated genes and cell types with GWAS p-values and gene/transcript expression profile. The GWAS p-values types and expression were analyzed by an iterative prioritization procedure. In the procedure, phenotype-associated genes were prioritized by a conditional gene-based association(using the ECS again) according to the genes’ selective expression in disease related cell-types while the phenotype related cell-types were prioritized by an enrichment analysis of Wilcoxon rank-sum test for phenotype-associated genes’ selective expression. The phenotype-associated gene list and phenotype related cell-type list were updated by turns until the two list were unchanged. The detailed method is described in our paper(Paper Link).
Required options
--gene-finemapping--expression-file [path/to/expression/file]--only-hgnc-gene--sum-file [/path/to/summary/file]--saved-ref [previous/output/path/prefix]--out [output/path/prefix]
See an analysis example at: Estimate relevant cell-types of a phenotype
Explanations and Optional options
--gene-finemapping: The main function option.--multiple-testing: The multiple testing method to select significant genes for the conditional analysis. There are three settings. bonf: Standard Bonferroni correction given a family-wise error rate specified by--p-value-cutoff. benfdr: Benjamini-Hochberg method to control the false discovery rate. fixed: Filtering by a fixed p-value cutoff.--p-value-cutoff: The cutoff for the multiple testing.--only-hgnc-gene: Only consider genes with hgnc gene symbols.--expression-file: The path of gene expression file.The expression file contains gene symbols(the first column), expression mean and standard errors of the gene or transcript in a cell types or clusters. One can include the Ensembl transcript ID of a gene in the first column. When a gene has multiple transcripts, each row can only contain the data of transcript. The standard error is not pre-requisite.
Gene
Cell_cluster1
Cell_cluster1.SE
Cell_cluster2
Cell_cluster1.SE
…
PRPF19:ENST00000541371
2.5
0.234
12.5
0.564
…
PRPF19:ENST00000541391
3.2343
0.4638
10.23
0.58
…
C19orf47:ENST00000580977
9.2343
0.8638
1.23
0.548
…
…
…
…
…
…
…
--sum-file: See above description.--filter-maf-le: See above description.--out: Specify the path and prefix name of the output files. One of main output files is the conditional gene-based analysis results, named *.finemapping.gene.ecs.txt or *. finemapping.gene.ecs.xls. The followingGene
Chrom
StartPos
EndPos
#Var
Group
ECSP
CondiECSP
GeneScore
C1orf162
1
112011621
112025081
21
0
2.73E-04
2.73E-04
3443
LINC01703
1
226266440
226282822
33
0
2.09E-04
2.09E-04
233.1
…
…
…
…
…
…
…
…
…
columns in the output file are gene symbol, chromosome, transcription start position, transcription end position, number of variants in the gene, the LD group ID of genes, p-values of gene-based association test, p-values of conditional gene-based association test, and the selective expression score in enriched tissue or cell-types.
Another main output files is the selective expression enrichment analysis results at different tissues or cell types, named *.celltype.txt or *. celltype.xls. The following
TissueName
RobustRegressionZ
AveragedLog(p)
Kidney-Cortex
1.70E-03
2.765004628
Brain-Cortex
2.30E-02
1.639680865
Bladder
2.50E-02
1.597056329
Brain-Hippocampus
2.70E-02
1.561281239
Colon-Transverse
3.00E-02
1.527765274
…
…
…
columns in the output file are tissue or cell-type names, the p-value of enrichment according to the selective expression derived from the robust regression z-score, the logarithm of p-value.
4.3 Multi-strategy Conditional Gene-based Association framework mainly guided by eQTLs (eDESE)
eDESE can be used to perform the conditional gene-based association analysis using different variant sets, i.e., physically nearby variants, gene-level and isoform-level eQTLs. The statistical method is the improved effective chi-square statistics (ECS). The pre-calculated gene-level and isoform-level eQTLs of 50 tissues or cell types from GTEx (v8) have been integrated into the KGGSEE resource (hg19 and hg38).
Required options
--gene-finemapping--eqtl-file [path/to/eQTL/file of genes or transcripts]--filter-eqtl-p--expression-file [path/to/expression/file]--sum-file [/path/to/summary/file]--filter-maf-le--saved-ref [previous/output/path]--out [output/path/prefix]--nt--chrom-col--pos-col--p-col--only-hgnc-gene--p-value-cutoff--multiple-testing--regions-out
See analysis examples at: Conditional gene-based association analysis based on the improved ECS and multiple variant-gene mapping strategies
Explanations and Optional options
--nt: Specify the number of CPU cores used for the analysis.--gene-finemapping: No parameters required. The main function option.--multiple-testing: Specify the multiple testing methods to select significant genes for the conditional analysis. There are three settings, i.e., bonf: Standard Bonferroni correction, benfdr: Benjamini-Hochberg method to control the false discovery rate, fixed: Filtering by a fixed p-value cutoff.--p-value-cutoff: Specify the family-wise cutoff for the multiple testing.--only-hgnc-gene: No parameters required. If used, KGGSEE only considers the genes with HGNC gene symbols.--expression-file: Specify the path of the preproceeded gene expression file. The index column of the preprocessed expression file was gene/isoform symbol name, and each of 50 tissues or cell types had two columns: one representing averaged expression value (i.e., mean) of all samples and the other representing the standard error of the mean (SE).--filter-eqtl-p: Specify the filter to select the significant gene/isoform-level eQTLs to enter the following gene-based association analysis.--sum-file: Specify the full path of the GWAS summary statistics. Three columns of the GWAS summary statistic file, i.e., chromosome, physical position and p-value are minimally required. The default column names are CHR, BP and P, respectively. Users can also specify these names by using--chrom-col,--pos-coland--p-col, respectively.--filter-maf-le: Specify the filter used to select the variants with MAF > the cutoff to enter the following gene-based association analysis.--regions-out: Location section, such as chr6:27477797-34448354. Specify the variants in the specified regions to be excluded in the following gene-based association analysis.--eqtl-file: Specify the full path of gene-level and isoform-level eQTL file. The format of the eQTL file is similar to the fasta file. The first row starting with "#" is the column name. Then the eQTL data of a gene or transcript starts with the symbol “>”, and the following are the gene symbol, Ensembl gene/transcript ID and chromosome name, which are delimited by tab characters. The subsequent rows contain the summary statistics of the eQTL-gene/isoform association. The tab-delimited columns are physical position, reference allele, alternative allele, frequency of alternative allele, estimated effect size, standard error of the estimation, p-value, effective sample sizes and determination coefficient in linear regression, respectively. In the regression, the number of alternative alleles is used as an independent variable. Based on KGGSEE, we have pre-calculated the eQTL data using the GTEx data(v8). Variants within 1MB upstream and downstream of a gene or a transcript boundary are included. The commands to compute eQTLs can be seen in Compute the gene-level and isoform-level eQTLs of each tissue.An example of gene-level eQTLs file is as follows:
#symbol id      chr     pos     ref     alt     altfreq beta    se      p       neff    r2
>WASH7P ENSG00000227232 1
52238   T       G       0.942   -1.771  0.285   5.16E-10        65      0.38
74681   G       T       0.95    -1.457  0.333   1.19E-5 63      0.239
92638   A       T       0.241   0.547   0.206   7.93E-3 53      0.121
>MIR1302-10     ENSG00000284557 1
52238   T       G       0.942   -1.771  0.285   5.16E-10        65      0.38
74681   G       T       0.95    -1.457  0.333   1.19E-5 63      0.239
 …      …       …       …       …       …       …       …       …
An example of isoform-level eQTLs file is as follows:
#symbol id      chr     pos     ref     alt     altfreq beta    se      p       neff    r2
>DDX11L1        ENST000456328   1
13418   G       A       0.161   -0.03   0.013   0.027   62      0.076
19391   G       A       0.11    0.065   0.027   0.017   63      0.085
107970  G       A       0.285   -0.024  0.01    0.018   86      0.063
>MIR6859        ENST0000612080  1
13418   G       A       0.161   -0.03   0.013   0.027   62      0.076
19391   G       A       0.11    0.065   0.027   0.017   63      0.085
62578   G       A       0.081   0.062   0.024   7.98E-03        67      0.098
99334   A       G       0.088   0.071   0.035   0.043   56      0.07
…       …       …       …       …       …       …       …       …
--out: Specify the path and prefix name of the output files.For eDESE, the six output files are as follows:
The first output file is the conditional gene-based analysis results, named *.finemapping.gene.ecs.txt or *.finemapping.gene.ecs.xls (We get the susceptible genes based on this file).
Gene
Chrom
StartPos
EndPos
#Var
Group
ECSP
CondiECSP
GeneScore
PLCH2
1
2394074
2441392
90
0
3.32E-07
3.32E-07
1749.814941
LINC01672
1
6779717
6794311
28
0
1.09E-07
1.09E-07
1459.64502
RERE-AS1
1
8481016
8498680
22
0
1.60E-07
1
276.8022156
GMEB1
1
28990270
29050710
61
1
1.21E-07
1
190.6436615
OPRD1
1
29136686
29202162
165
1
4.88E-08
4.88E-08
1776.521118
LINC01648
1
30481836
30513725
84
1
4.24E-07
8.76E-07
1310.996948
C1orf216
1
36174770
36186112
12
2
9.41E-07
9.41E-07
1644.873169
AGO3
1
36398368
36540415
67
2
1.02E-06
0.019723344
411.5656128
MAP7D1
1
36616941
36650961
23
2
4.86E-07
4.86E-07
1217.979736
MPL
1
43800001
43822665
17
3
5.19E-07
1
1179.628052
Gene: gene name;
Chrom: chromosome position of the gene;
StartPos: gene start position (refGene hg19);
EndPos: gene end postion (refGene hg19);
#Var: the number of variants assigned to the gene according to different strategies (physically nearby variants for eDESE:dist, gene-level eQTLs (also are variants) for eDESE:gene, isoform-level eQTLs (also are variants) for eDESE:isoform);
Group: the identifier of LD block to which the gene belongs;
ECSP: the p-value of effective chi-square test (without conditioning on gene expression profiles);
CondiECSP: the p-value of the gene by performing the conditional effective chi-square test;
GeneScore: the tissue-selective score of the gene by the end of the iterative procedure;
The second output file is the gene-based association result file ("gene-top variant" ECS result), named *.gene.pvalue.txt or *.gene.pvalue.xls.
Gene
#Var
ECSP
Chrom
Pos
GWAS_Var_P
RNU6-1199P
1
0.9428
1
693731
0.9428
FAM87B
16
0.90109217
1
752566
0.7723
LINC01128
48
0.842458397
1
776546
0.3348
LINC00115
11
0.926980956
1
760912
0.7847
FAM41C
19
0.91792081
1
810286
0.3687
TUBB8P11
8
0.816456433
1
810286
0.3687
LINC02593
38
0.110157913
1
852133
0.01991
SAMD11
30
0.217041605
1
879676
0.0197
NOC2L
26
0.397219233
1
891021
0.0129
KLHL17
21
0.17778506
1
891021
0.0129
Gene: gene name;
#Var: the number of variants assigned to the gene according to different strategies (physically nearby SNPs for eDESE:dist, gene-level eQTLs (also are variants) for eDESE:gene, isoform-level eQTLs (also are variants) for eDESE:isoform);
ECSP: the p-value of effective chi-square test (without conditioning on gene expression profiles);
Chrom: chromosome position of the gene;
Pos: the position of top-variant belonging to the gene;
GWAS_Var_P: the p-value of the top-variant in GWAS summary statistics.
Especially, additional three columns are appended to the *.gene.pvalue.txt or *.gene.pvalue.xls generated by eDESE:gene and eDESE:isoform (see example below).
Gene
#Var
ECSP
Chrom
Pos
GWAS_Var_P
eQTL_P
eQTL_Beta
eQTL_SE
CDK11A
46
0.291482878
1
2254910
0.009276
0.00335
0.419
0.143
TMEM240
22
0.025449014
1
1885055
0.003213
0.004
0.467
0.162
FNDC10
22
1.56E-04
1
2373089
4.85E-07
0.00152
0.412
0.13
UBE2J2
52
0.061003298
1
2114271
0.001515
8.32E-04
-0.878
0.263
C1orf159
164
0.013052155
1
1882949
4.82E-05
0.00461
0.486
0.172
CCNL2
7
0.1832933
1
1373335
0.05406
0.00548
-0.376
0.135
MIB2
95
0.001354836
1
1882949
4.82E-05
0.00419
0.481
0.168
WASH7P
1
0.3348
1
776546
0.3348
0.00603
0.39
0.142
LINC01786
20
0.222666606
1
1373335
0.05406
3.54E-04
-0.509
0.143
PUSL1
30
0.241421866
1
2122723
0.003085
0.005
-0.767
0.273
eQTL_P: the variant-gene expression association p-value of the top-variant with the gene;
eQTL_Beta: the variant-gene expression association beta value of the top-variant with the gene;
eQTL_SE: the standard error of the mean of beta value.
The third output file is the p-value of all variants belonging to a gene (raw ECS results), named *.gene.var.pvalue.txt.gz. Their file formats are the same as above. The meaning of the column names in *.gene.var.pvalue.txt.gz is the same as that in *.gene.pvalue.txt.
Gene
#Var
ECSP
Chrom
Pos
GWAS_Var_P
RNU6-1199P
1
0.9428
1
693731
0.9428
FAM87B
16
0.90109217
1
752566
0.7723
FAM87B
16
0.90109217
1
754964
0.7767
FAM87B
16
0.90109217
1
752721
0.7878
FAM87B
16
0.90109217
1
754503
0.807
FAM87B
16
0.90109217
1
758626
0.8899
FAM87B
16
0.90109217
1
758144
0.9102
FAM87B
16
0.90109217
1
757936
0.9151
FAM87B
16
0.90109217
1
757734
0.9156
FAM87B
16
0.90109217
1
756604
0.916
The fourth output file is the significance of phenotype-associated tissues, named *.celltype.txt.
TissueName
RobustRegressionZ
AveragedLog(p)
Brain-FrontalCortexBA9
1.30E-17
16.90010754
Brain-AnteriorcingulatecortexBA24
2.40E-17
16.61350308
Brain-Cortex
1.60E-16
15.79927424
Brain-Hippocampus
1.90E-13
12.72137284
Brain-Caudatebasalganglia
5.80E-13
12.23746327
Brain-Putamenbasalganglia
6.50E-13
12.18921402
Brain-Amygdala
1.40E-12
11.85870189
Brain-Nucleusaccumbensbasalganglia
5.60E-12
11.24812294
Brain-Substantianigra
2.40E-10
9.614009191
Brain-Hypothalamus
4.30E-10
9.370307784
TissueName: tissue names;
RobustRegressionZ: The p-value generated by the Wilcoxon rank-sum test based on the robust-regression z-score of the potential susceptibility and non-susceptibility genes.
AveragedLog(p): the negative log10 of the p-values generated by averaging the p-values of four selective-expression measures (robust-regression z-score, conventional z-score, MAD robust z-score, and ratio of vector-scalar projection).
The fifth output file is a Q-Q plot, named *.qq.png, representing the p-value of the ECS test based on gene, variants insides the gene and variants outside the gene, respectively.
The sixth output file is the log file in which the detailed parameter settings and computation procedures can be found.
4.4 Infer the causal genes based on GWAS summary statistics and eQTLs by Mendelian randomization analysis framework for causal gene estimation(EMIC)
One can perform multiple IVs-based MR analyses to infer the causal genes or transcripts by using the integrative framework named EMIC. EMIC adopted two multiple IVs-based MR methods for causality test and casual effect estimation of a gene’s expression to a phenotype, median-based MR and ML-based MR. EMIC needs two major inputs, GWAS and eQTL summary statistics, respectively. The GWAS summary statistics refer to the logarithm of odds ratio or regression coefficients and the corresponding standard errors(SEs) from a large-scale GWAS study, indicating the association between IVs and a phenotype. The eQTL summary statistics are similar to that of the GWAS, indicating the association between IVs and the expression of genes or transcripts in a tissue or cell type. EMIC has integrated the pre-calculated cis-eQTLs in 50 tissues or cell-types with gene-level and isoform-level expression from GTEx(version 8).
Required options
--emic--eqtl-file [path/to/eQTL/file of genes or transcripts]--sum-file [/path/to/summary/file]--beta-type [0/1/2]--saved-ref [previous/output/path]--out [output/path/prefix]
See an analysis example at: Gene-based causality analysis
Explanations and Optional options
--emic: No parameters required. The main function option.--eqtl-file: See above description.--sum-file: See above description.--beta-type: The altenative values are 0, 1 or 2. Specially, 0 represents the coefficients of linear regression for a quantitative phenotype; 1 represents the coefficients of logistic regression or the logarithms of odds ratio for a qualitative phenotype; 2 represents the odds ratio for a qualitative phenotype.--saved-ref: See above description.--out: Specify the path and prefix name of the output files. The main output file is the Mendelian randomization analysis results for causal gene estimation, named *.mr.gene.txt or *. gene.mr.gene.xls. The followingGene
#Var
minP_MedianMR
DetailsMedianMR
minP_MLMR
DetailsMLMR
Chrom
Pos
GWAS_Var_P
GWAS_Var_Beta
GWAS_Var_SE
eQTL_P
eQTL_Beta
eQTL_SE
AMPD1
3
.
ENST00000639274[2,NaN,NaN,NaN]
9.38E-06
ENST00000639274[2,-0.07947323864224412,0.017935971853054997,9.382262412244995E-6]
1
115309590
8.83E-08
1.057384
0.0104
4.65E-05
-0.613
0.151
RN7SL432P
3
.
ENST00000484057[2,NaN,NaN,NaN]
9.38E-06
ENST00000484057[2,-0.07947323864224412,0.017935971853054997,9.382262412244995E-6]
1
115309590
8.83E-08
1.057384
0.0104
4.65E-05
-0.613
0.151
…
…
…
…
…
…
…
…
…
…
…
…
…
…
Columns in the output file are gene symbol, the number of variants in the gene, p-values of causality tests by Median-based MR, detailed causality estimation by Median-based MR, p-values of causality tests by maximal likelihood-based MR, detailed causality estimation by maximal likelihood-based MR, chromosome, top GWAS variant position, p-value, beta and SE of the top GWAS variant, p-value, beta and SE of the top GWAS variant as an eQTL. When a gene has multiple transcripts, the detailed MR results will show MR analysis of all transcripts. Each MR analysis result has four components, the number IVs for the estimation, the estimated causal effect, the standard error of the estimation, and the p-values.
4.5 Compute the gene/isoform-level eQTLs of each tissue
Purpose: compute the gene/isoform-level eQTLs based on the gene-level expression and isoform-level expression profiles of the target tissue.
Input data:
Genotypes in KGGSEE objects (generated in Gene-based association analysis). Here genotypes in GTEx v8 were used as example input. When computing the gene/isoform-level eQTLs of certain tissue, only subjects simultaneously containing the genotype data and expression data were used;
Gene expression data of certain tissues corresponding to genotype data from the same subjects;
Subject information, such as subject ID and subject-related covariates.
java -Xmx10g \
-jar kggsee.jar \
--nt 10 \
--calc-eqtl \
--expression-gty-vcf  path/to/vcf/file/of/subjects/with/expression \
--gene-expression resources/Adipose-Subcutaneous.expression.subjectid.gene.fmt.gz \
--expression-subjects path/to/subjectID/covariates.txt \
--filter-eqtl-p 0.01 \
--hwe-all 0.001 \
--filter-maf-le 0.05 \
--neargene 1000000 \
--out /path/Adipose-Subcutaneous.gene.maf05.p01 \
Details of the options can be seen in Options Index.
5 Options Index
5.1 Inputs/outputs
Option
Description
Examples with default value
--a1-col
column name of alternative or minor allele
--a1-col A1
--a2-col
column name of reference or major allele
--a2-col A2
--beta-col
column name of coefficients
--beta-col OR
--beta-type
whether the coefficients are odds ratio. 0 means coefficients of linear regression for a quantitative phenotype beta; 1 means coefficients of logistic regression or the logarithms of odds ratio for a qualitative phenotype; 2 means the odds ratio for a qualitative phenotype
--beta-type 0
--chrom-col
column name of chromosome ID
--chrom-col CHR
--eqtl-file
path of eQTL file
--eqtl-file /path/to/eqtl_file
--excel
Output results in Excel format
--expression-gty-vcf
path to vcf file of subjects with expression
--expression-gty-vcf /path/to/vcf_file
--gene-expression
path to file with gene expression
--gene-expression /path/to/gene_expression_file
--freq-a1-col
column name of frequencies of A1 allele
--freq-a1-col FRQ_U
--keep-ref
save the encoded genotypes in VCF for future usage
--nmiss-col
column name of sample size with non-missing genotypes
--nmiss-col Neff
--out
output path and prefix name
--out ./test/test1
--pos-col
column name of positions
--pos-col BP
--p-col
column name of p-values
--p-col P
--saved-ref
the path of encoded genotypes by last time
--saved-ref 、test/test1
--se-col
column name of standard errors of the coefficients
--se-col SE
--sum-file
path of the file storing GWAS summary statistics
--sum-ref /path/to/gwas_summary_file
--vcf-ref
the path of vcf file and name
--vcf-ref /path/to/vcf_file/hg19.chr*.vcf.gz
5.2 Quality control
Option
Description
Examples with default value
--filter-eqtl-p
filter eQTLs with p-value > the cutoff
--filter-eqtl-p 1E-2
--filter-maf-le
filer variants with MAF ≤ the cutoff
--filter-maf-le 0.05
--hwe-all
filter variants with HWD test p-value < the cutoff
--filter-eqtl-p 1E-5
--only-hgnc-gene
only consider genes with HGNC gene symbols
--neargene
set the extension window size of a gene to cover more potential regulatory variants.
--neargene 5000
--regions-out
exclude variants in the specified regions
5.3 Functions
Option
Description
Examples with default value
--gene-assoc
Perform gene-based association analysis
--emic
Perform Mendelian randomization analysis for causal gene estimation
--calcu-selectivity
An inner function for DESE and eDESE to calculate selective expression of gene or transcripts in a tissue or a cell type. Default parameter is "true".
--calcu-selectivity true
--ld-pruning-mr
Prune a variant with genotypic correlation to another variant> the cutoff for causal gene estimation by MR
--ld-pruning-mr 0.5
--multiple-testing [bonf/benfdr/ fixed]
The multiple testing method used to select significant genes for the conditional gene-based analysis. There are three settings. bonf: Standard Bonferroni correction given a family-wise error rate specified by --p-value-cutoff. benfdr: Benjamini-Hochberg method to control the false discovery rate. fixed: Filtering by a fixed p-value cutoff.
--multiple-testing bonf
--p-value-cutoff
The family-wise cutoff for the multiple testing.
--p-value-cutoff 0.05
--top-gene
Only select the N top significant genes for subsequent gene-based conditional analysis by ECS
--top-gene N
5.4 Utilities
Option
Description
Examples with default value
--nt
CPU cores for the analysis
--nt 12
--buildver
reference genome version of the coordinates. The supported versions are hg19 and hg38.
--buildver hg19
--resource
the path and folder of kggsee.